The Lawrence Livermore National Laboratory energy-flow chart shows how energy moves through the U.S. economy. Its 2023 industrial figures include 26.1 quadrillion Btu of consumption and about 13.3 quadrillion Btu of rejected energy.
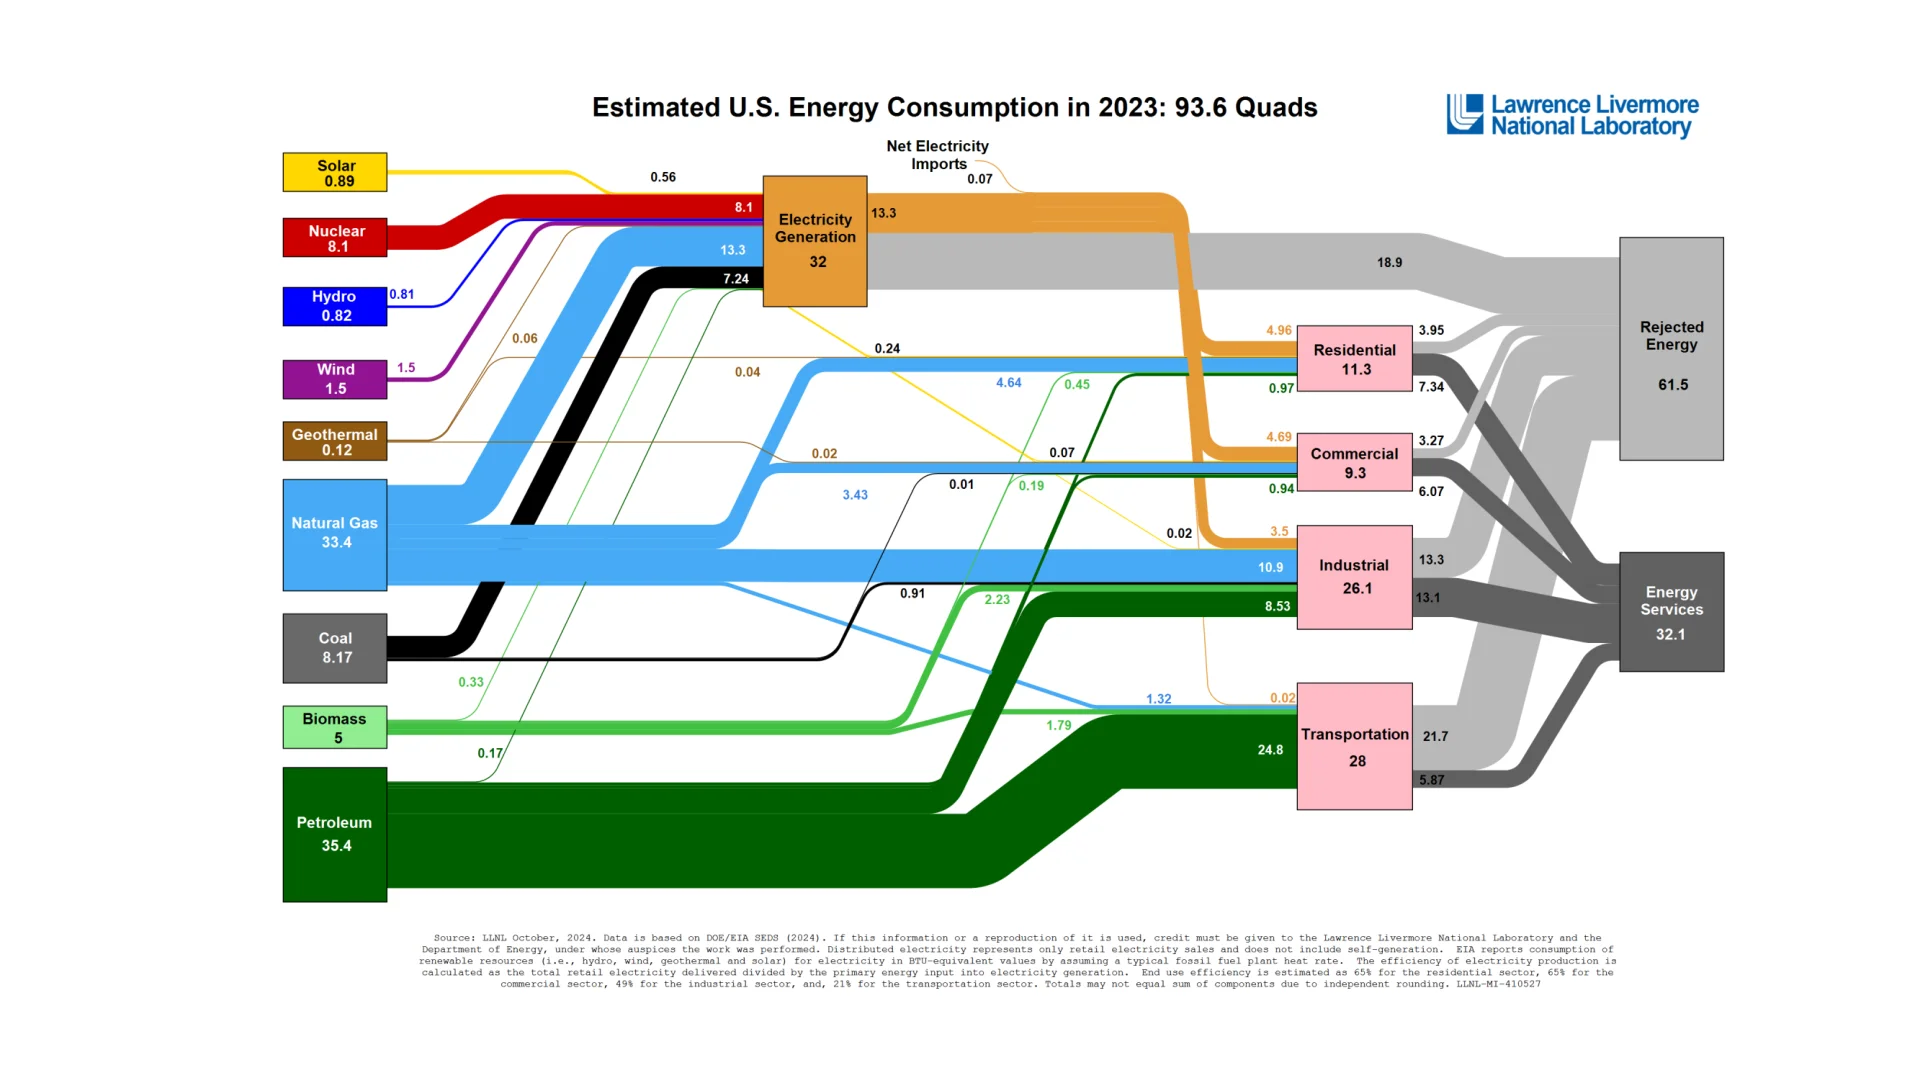
That illustrates the scale of the issue, but it does not mean that half of every plant's purchased energy is economically recoverable. The chart uses sector-level assumptions; an individual site's opportunities depend on its processes and operating conditions.
Steam leaks, failed traps and ineffective condensate recovery are common places to investigate. Beyond those losses, heat recovery may reduce fuel consumption when the available heat matches a useful demand in temperature, quantity and timing.
A plant energy audit follows generation, distribution and end use to identify those opportunities. CPE connects the findings to production needs, implementation costs and expected returns so the plant can decide which work to undertake first.